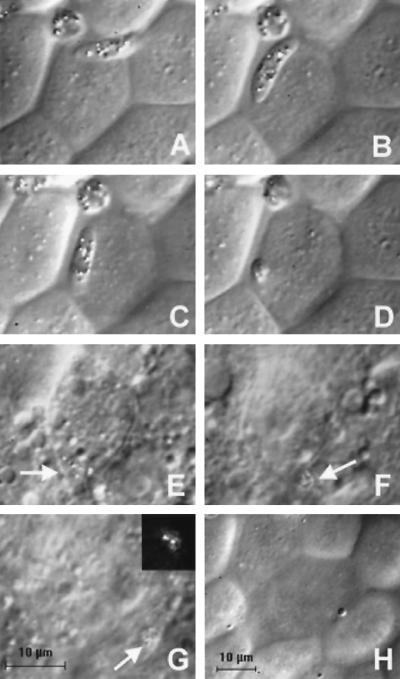
Figure 1.
DIC images of the invasion of a P. gallinaceum ookinete into an A. aegypti midgut cell. The times are given relative to the start of invasion. The scale bar in G is for images A–G; image H is reduced in magnification to show the difference in refractive index of invaded cells relative to neighboring cells. (A) T = −48 sec. (B) T = −15 sec. The ookinete is gliding on the surface of the cell to be invaded. (C) T = 0 sec. Invasion into the lateral apical membrane of the midgut cell has begun and the anterior end of the ookinete has disappeared beneath the cell surface. (D) T = 7 sec. Invasion is near completion, and only the posterior end of the ookinete is visible on the midgut cell surface. (E) T = 2.8 min. The ookinete (arrow) is barely visible inside the invaded cell. (F) T = 3.4 min. The ookinete (arrow) invades a neighboring cell. (G) T = 5.0 min. The ookinete (arrow) is entirely within the neighboring cell. (Inset) Polarized light microscopy unambiguously identifies the position of the ookinete on the basis of the birefringent hemozoin pigment granules. (H) T = 11.3 min. The change in surface morphology and decrease in refractive index of invaded cells are hallmarks of the invasion process.

