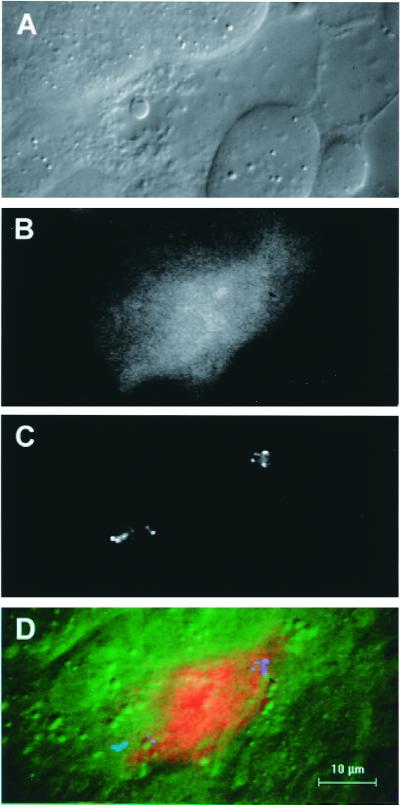
Figure 4.
Images of an invaded cell stained with PhiPhiLux-G1D2. (A) DIC image of the invaded cell. (B) Increased fluorescence of the invaded cell compared with its neighbors. (C) Polarized light microscope image of hemozoin pigment granules of two ookinetes in the invaded cell. (D) Composite color image with DIC in green, fluorescence in red, and ookinete position in blue, showing the overall relationship between these three independent parameters.

