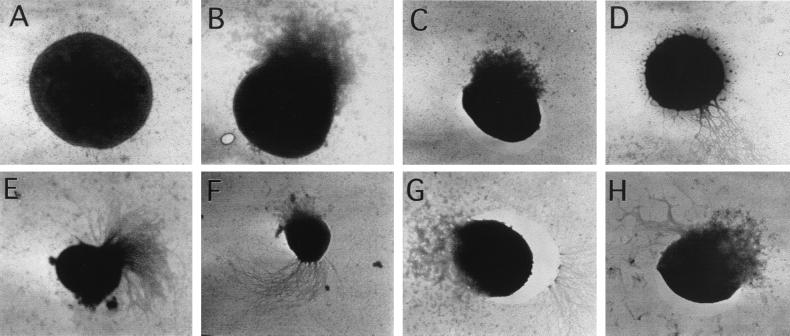
Figure 3.
Electron micrographs of negatively stained M. jannaschii cells. The cells were from the following samples that were collected from the logarithmic phase of a reactor culture raised at a pH2 of 178 kPa (see Table 2). (A–D) Sample EM-1; (E–H) sample EM-4. Magnifications (×103): (A) 10.5; (B) 9.4; (C) 5.4; (D) 5.5; (E) 5.6; (F) 5.5; (G) 8.3; and (H) 6.8. To generate the data in Table 2, cell types A, B, and C were scored as nonflagellated; D, E, F, G, and H were scored as flagellated.

