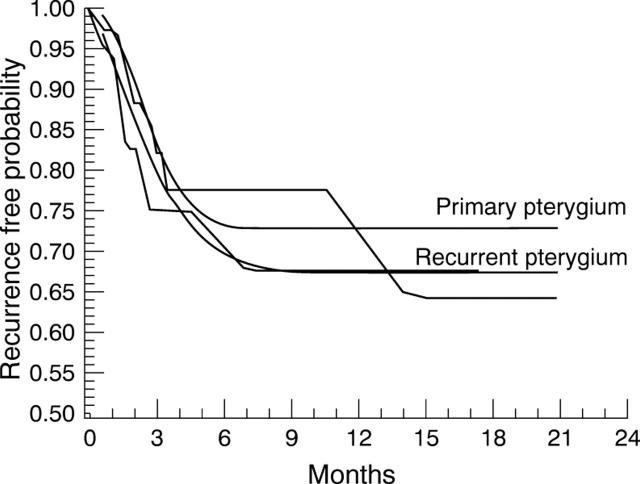
Figure 1 .
Ordinary lines show recurrence free survival for primary pterygium, bold lines for recurrent pterygium. The irregular lines are estimates derived using Turnbull's method, while the smooth curves are Weibull distributions fitted to the same data, incorporating a proportion of the patients who never have a recurrence.

