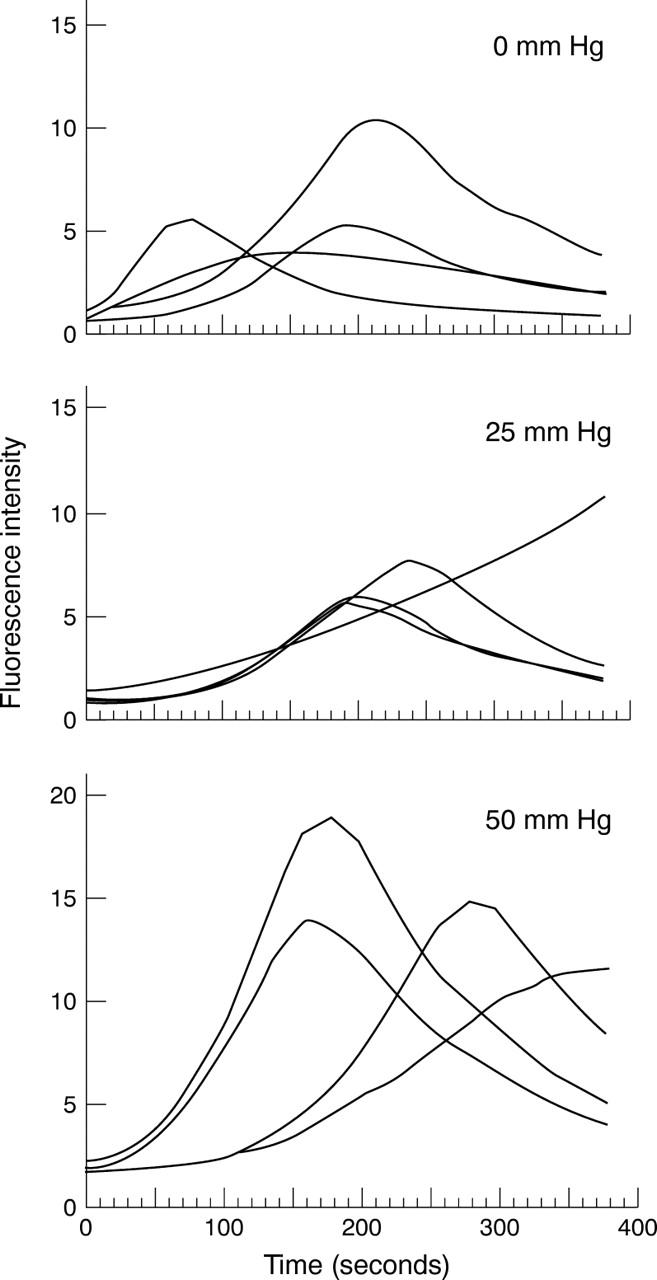
Figure 3 .

Spontaneous fluctuation of intracellular nitric oxide in each cell at the pressure of 0, 25, and 50 mm Hg during 400 seconds of observation. Fluorescence intensity in each cell of the series of 20 images (shown partly in Fig 2) is quantified. Fluorescence intensity is given in arbitrary units.
