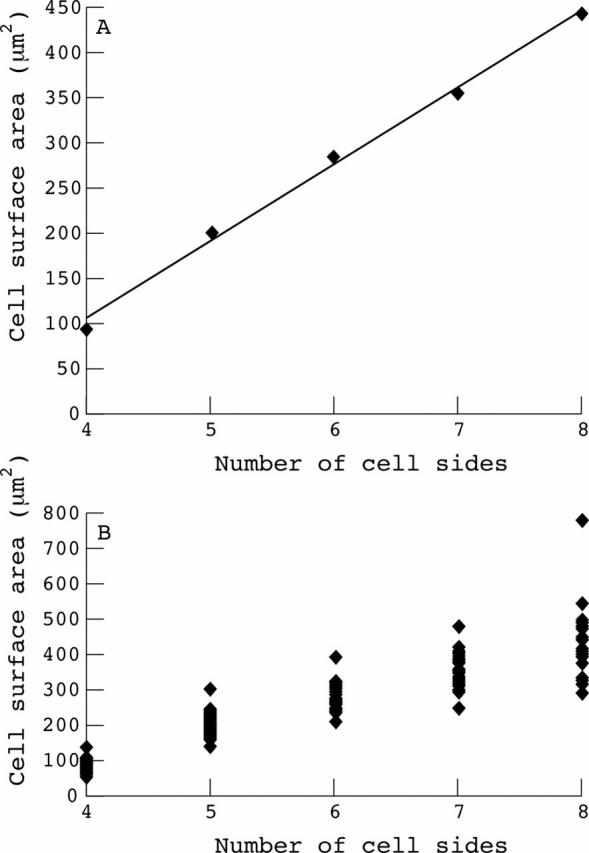
Figure 4 .

Area side relations for corneal endothelial cells. The group averaged mean value for the area of each cell type (four, five, six sided, etc) is plotted against the number of cell sides (A) or the mean values from each data set shown in the scatter plot (B). The linear regression shown in (A) is statistically significant (p <0.01; r2 value of 0.993), while the χ2 value across groups in (B) is highly significant at 142 (4 dF, p <0.01).
