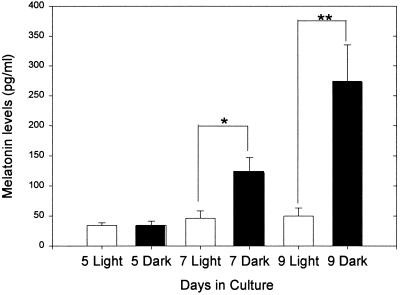
Figure 3.
Melatonin levels ± SEM measured in dispersed pineal cells cultured for 5, 7, and 9 days (n = 20–22 cultures for each treatment). Melatonin levels were measured at the end of a 6-h period of stimulation with 10 μM NE, during which the cells were exposed either to light (open bars) or dark (solid bars). ** denotes P < 0.01.

