
Figure 3 .
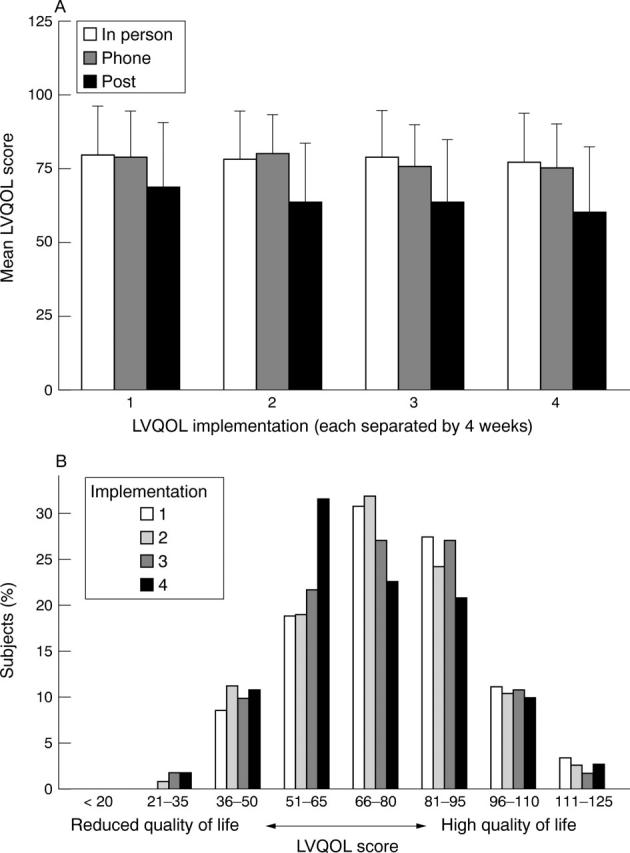
(A) Mean summed score for the LVQOL questionnaire over a 3 month period by post (n=39), by telephone (n=39), or by in-person (n=39) interviews. There was no significant difference in scores over this time period, but those completing the questionnaire by post had an apparently lower quality of life. Error bars = 1 SD. (B) Distribution of summed LVQOL scores over a 3 month period. There was a decrease in apparent LVQOL score 3 months after the initial implementation, but this was not found to be significant (n=117).