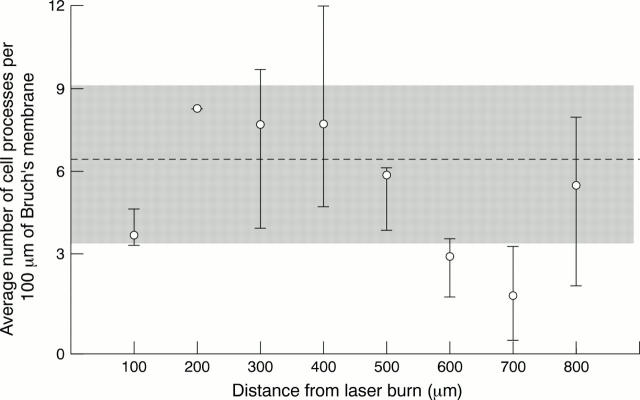
Figure 5 .
Graph of the average number of processes per 100 µm of Bruch's membrane against the distance from the laser burn in patient 2. Patient 2 received laser treatment 15 hours before exenteration. The shaded area represents the range in the number of processes seen in the untreated half of patient 2's retina. The broken line is the average number seen per 100 µm.

