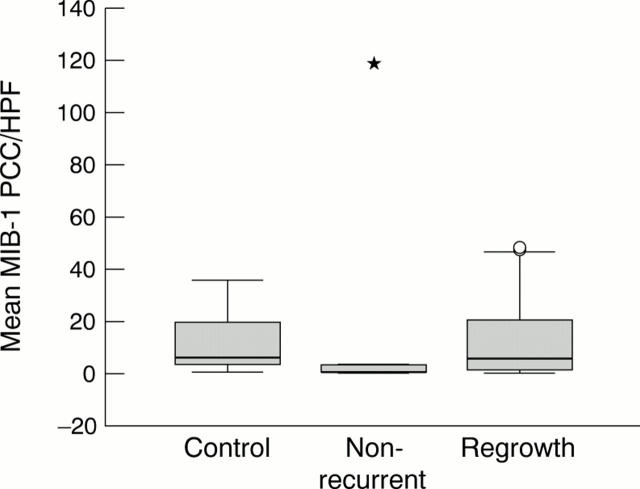
Figure 2 .
Box plot analyses of the proliferative activity of melanoma cells in the control, non-recurrent, and regrowth groups as estimated by MIB-1 immunostaining. The thick horizontal lines show the median of the distribution of MIB-1 positive cell count (PCC) per HPF, the boxes represent the interquartile range (IQR), and individual circles and asterisks represent outliers. A circle is more than 1.5 times IQR above the upper quartile, and an asterisk is more than three times IQR above the upper quartile.

