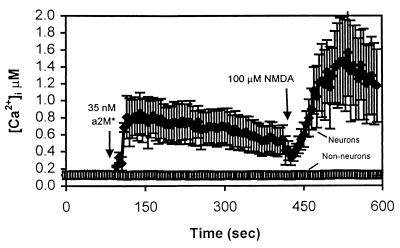
Figure 1.
α2M* increases [Ca2+]i specifically in neurons. Primary cultures of mouse cortex were loaded for 30 min with 1 μM indo-1/AM and imaged by using a Bio-Rad 1024 Multiphoton confocal microscope. The traces represent a time course of intracellular calcium concentration in a field of cells in a single, representative experiment. Each trace is the average of six cells within the field, ± SD. Not all cells in the mixed cultures responded to α2M* treatment. The cells that did respond resembled neurons morphologically and also responded to NMDA application. Nonresponders had the generally flat appearance of glia and/or fibroblasts and did not respond to NMDA addition.

