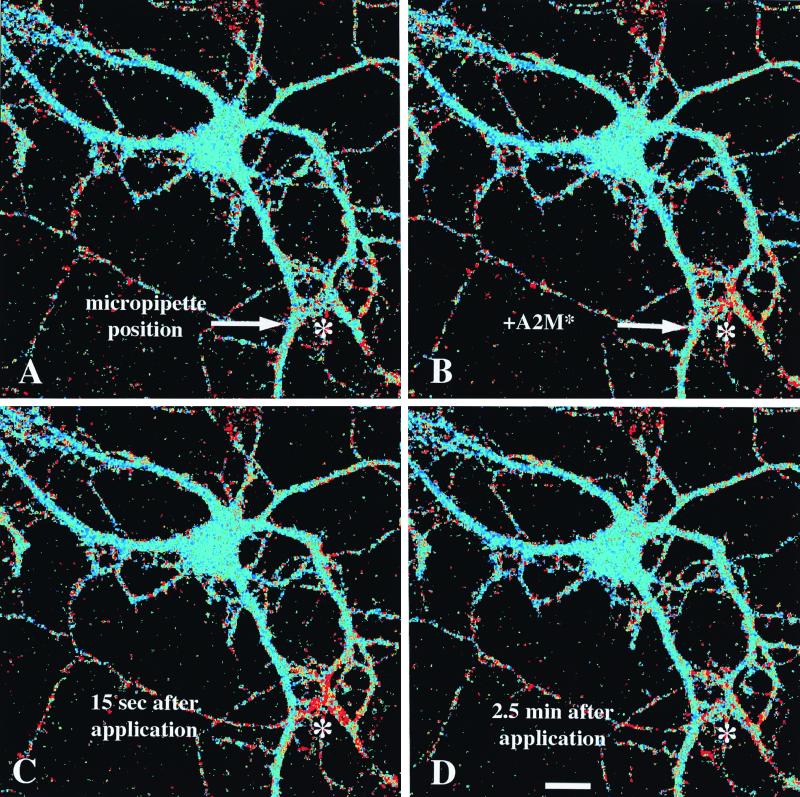
Figure 6.
The calcium response is spatially restricted. A single cell was imaged with a multiphoton confocal microscope. α2M* was loaded into a glass micropipette, which was positioned with a micromanipulator near dendritic processes of the cell in the lower right corner of each image, as indicated by the asterisk (*). (A) Pseudocolor image of the cell immediately before administering α2M*. Blue colors represent low [Ca2+]i, and greens to yellows then reds represent increasing [Ca2+]i. (B) An image immediately after a 100-msec pressure pulse through the pipette, emitting a restricted cloud of α2M* just above the dendrites. (C) The cell approximately 15 sec after the pressure pulse, when the calcium change reaches its peak within a radius of about 25 μm of the tip of the pipette. (D) An image of the cell 2.5 min after the pressure pulse. The calcium concentration has returned to baseline by this time point. This result is representative of n = 6 experiments.

