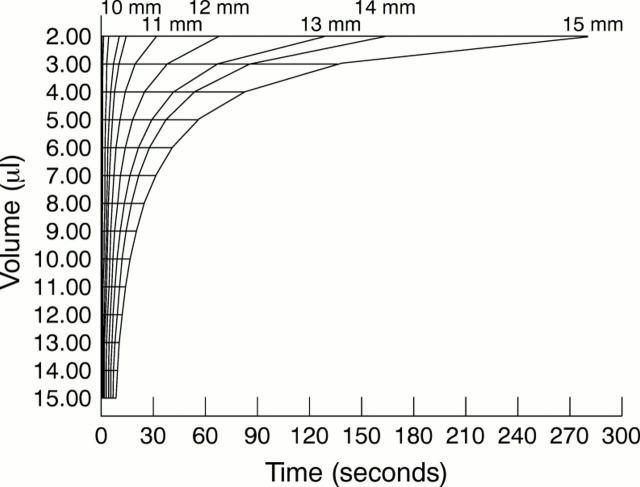
Figure 2 .
In vitro data: volume, distance, and time relation. Curves demonstrate time taken for a given volume to travel a given distance. Each of the 10 curves from left to right (15 mm to 6 mm), represent the distance travelled along the filter paper strip as measured from the filter paper notch. For example, if the filter paper is removed from the eye after 30 seconds and the distance as measured from the notch is 8 mm, this indicates that the filter paper was in contact with at least 5 µl of tears.

