Figure 1 .
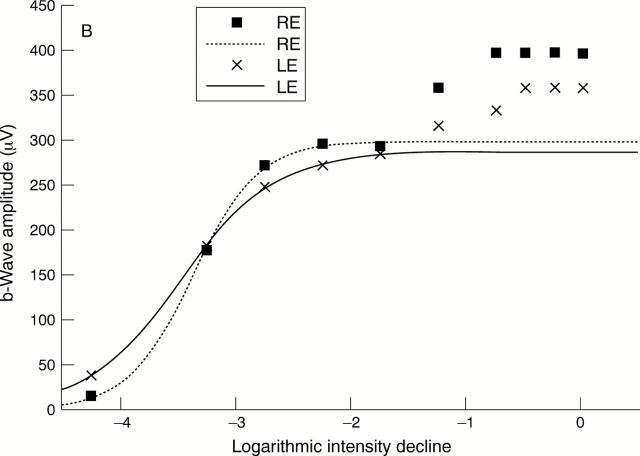
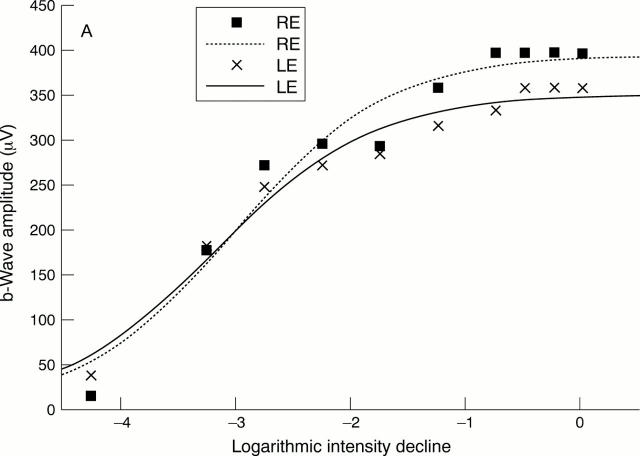
(A) Comparison between the intensity response data and the first model of the Naka-Rushton function fitted to all data points. The patient suffered from asymmetrical juvenile open angle glaucoma of the left eye (mean deviation in right eye (RE) -1.0 dB, mean deviation in left eye (LE) 8.7 dB). The parameters of the Naka-Rushton equation are: Vmax = 395 µm, K = -3.02 log units, n = 0.65 for the right eye and Vmax = 351 µm, K = -3.19 log units, n = 0.63 for the left eye. (B) Intensity response data of the right and left eyes of the same patient. In contrast to (A), this figure demonstrates the second model of the Naka-Rushton equation with fit of the function to data points below -1.25 log units (0.53 cd/s/m2) and thus below the "second limb" of the intensity response function. The parameters of the second model of the Naka-Rushton equation are: Vmax = 298 µm, K = -3.36 log units, n = 1.55 for the right eye and Vmax = 288 µm, K = -3.47 log units, n = 1.06 for the left eye.


