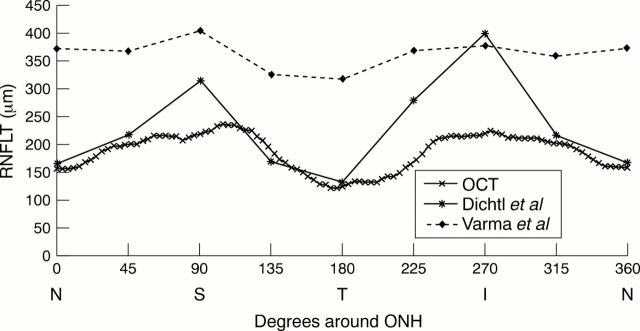
Figure 4 .
Plot of RNFL thickness according to angular location around the optic disc circumference. N = nasal, S = superior, T = temporal, I = inferior. Plots marked "OCT" represent values obtained by the OCT scan at the ONH margin. Those marked "Dichtl et al" and "Varma et al" represent RNFL thickness at the ONH margin as published by Dichtl et al,36 and Varma et al,35 respectively. Note the difference in modulation of the RNFL as measured by histology.

