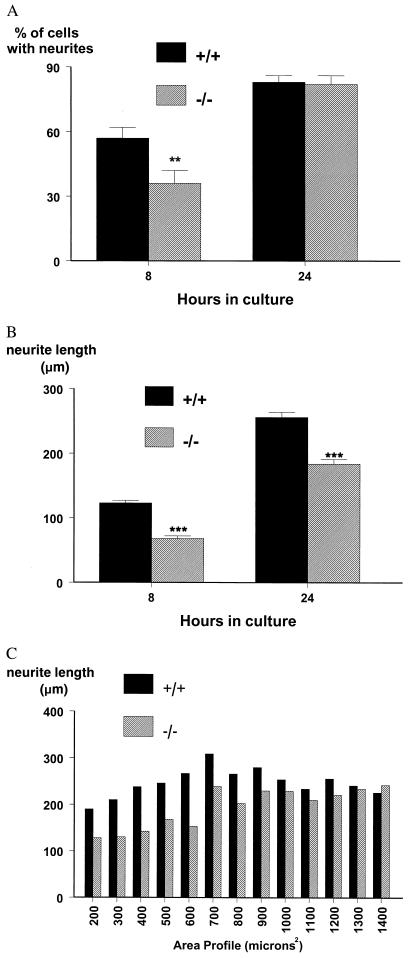
Figure 5.
(A) The percentage of cells bearing neurites at 8 and 24 h in culture from wild-type and mutant animals and (B) length of neurite outgrowth at both time points. In both cases, statistically significant deficits are noted in the mutant animals (t test; **, P < 0.01; ***, P < 0.001, n = 5). Data are presented as percentage of cells bearing neurites or mean neurite length ± SEM. (C) Neurite length as a function of area profile at 24 h in culture for both genotypes, demonstrating that small cells produce considerably shorter neurites in mutants compared with wild-type controls (n = 5).

