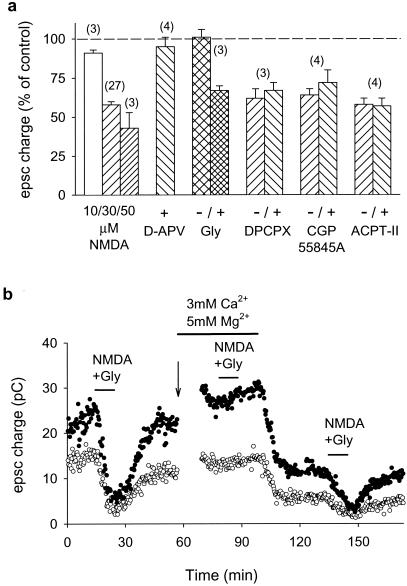
Figure 2.
Pharmacological characterization of the NMDA-induced depression of synaptic transmission. (a) Bar chart shows the effects (measured after 10 min of agonist application) of three different concentrations of NMDA in the presence of 10 μM glycine; 30 μM NMDA + 10 μM glycine in the presence of 50 μM d-APV; 30 μM NMDA with or without 100 μM glycine in the presence of 33 μM 7-chlorokynurenate; 30 μM NMDA + 10 μM glycine in the presence or the absence of 200 nM DPCPX, 5 μM CGP55845A, or 100 μM ACPT-II. Data represent mean ± SEM of n experiments (numbers in parentheses). (b) The NMDA-induced depression was sensitive to high extracellular Mg2+ (5 mM) and reappeared as soon as the Mg2+ concentration was returned to 1 mM. Paired first and second pulses are represented by ○ and ●, respectively. The arrow indicates a decrease in stimulation strength to obtain EPSCs of similar amplitude.

