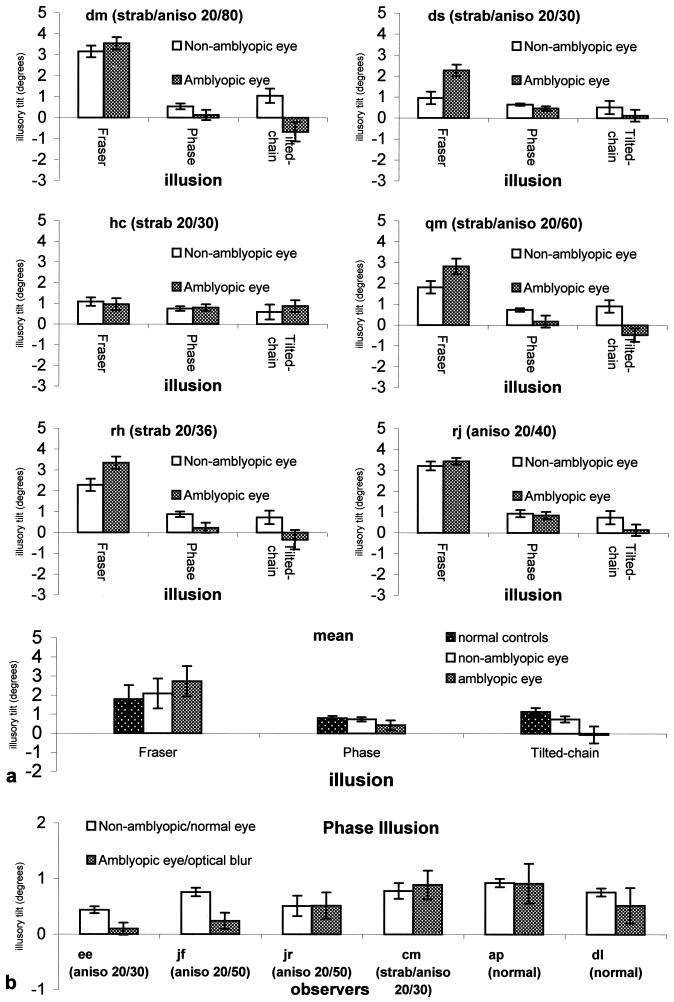
Figure 5.
Experiment 1: Comparison between amblyopic and normal illusory tilt. (a) Amblyopic and nonamblyopic illusory tilts for six amblyopes in the three illusions. Amblyopia type and depth of amblyopia are indicated for each observer (strab = strabismic, aniso = anisometropic, followed by acuity, e.g., 20/80). rj is a pure anisometrope, all others are strabismic. hc is an exception to the trends in all three illusions. Mean results of all of the amblyopes (including hc) are compared with means for six normal controls. (b) Phase illusion: data from four additional amblyopes are compared with two normal controls viewing with and without 5-diopter blur.

