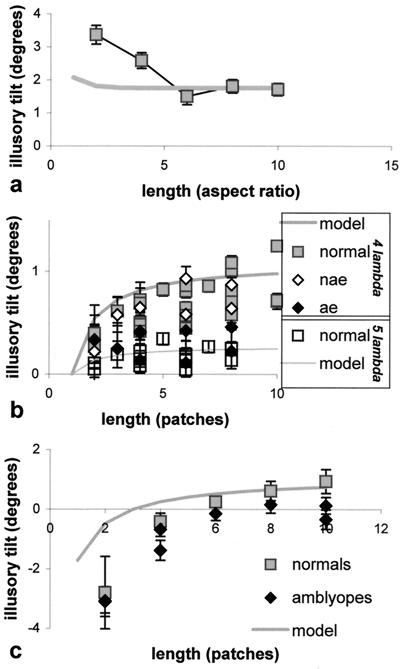
Figure 6.
Experiment 2: Effects of row length. Gray symbols, normal controls; filled symbols, amblyopic eye of amblyopes (ae); open symbols, nonamblyopic eye of amblyopes (nae); curves, model (see text for details). All error bars show 95% confidence interval. (a) Fraser illusion. Normal data shown indicate the mean of four observers. (b) Phase illusion. Normal data are shown by a scatter from five observers. The phase illusion persisted at 5 λ separation for three of the five normal observers. (c) Tilted-chain illusion. Normal data shown indicate the mean of four observers.

