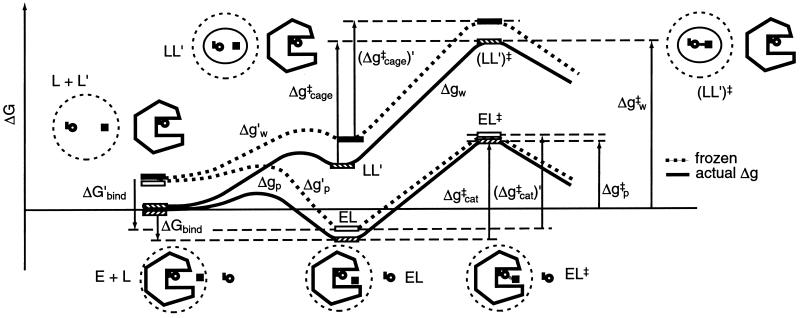
Figure 1.
Comparison of the free energy profiles Δg for a given reaction in a protein (Δgp‡) and in water (Δgw‡). The figure represents these free energy profiles in the absence (Δg) and presence (Δg′) of constraints for the movement of the reacting fragments. Note that Δgp‡ corresponds approximately to kcat/Km (it is given by ΔGbind + Δgcat‡). The figure uses the notation of L for ligand rather than S for substrate to prevent confusion with the symbol S used for entropy.

