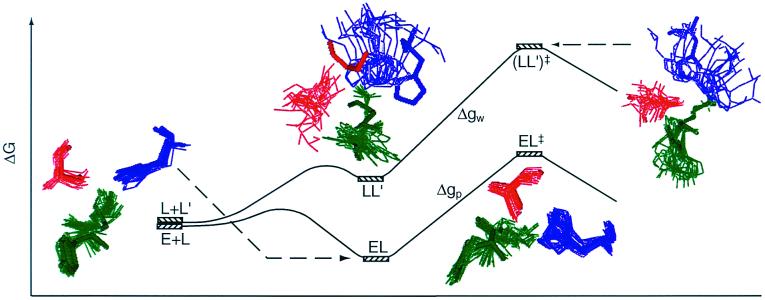
Figure 5.
Superposition of snapshots of the trajectories propagated at the last point of the FEP protocol where K changes from 0.003 to 0.0003 kcal/mol for the RS and the TS of the water surface (solid curve) and the protein surface (dashed curve). The free energy profiles are given in a schematic way. The 20 snapshots for each system were taken at equal time space during 50-ps runs. L designates ligand as in Fig. 1.

