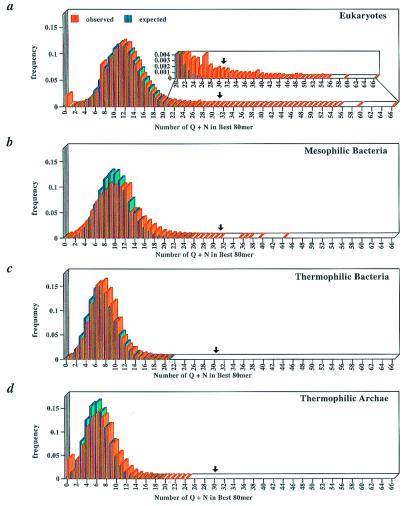
Figure 2.
Expected and observed distributions of Q/N content of the best 80 mers across mesophilic and thermophilic proteomes. A comparison of the expected and observed distributions of Q/N contents across the most Q/N-rich regions of (a) eukaryotes, (b) mesophilic bacteria, (c) thermophilic bacteria, and (d) archaea. Arrows indicate the minimum Q/N content required for a domain to be considered Q/N rich. (a Inset) Magnification of the observed and expected distributions of Q/N-rich regions. Expected values were calculated on the basis of the average Q/N content per best 80 mer for each of the four types of organisms.

