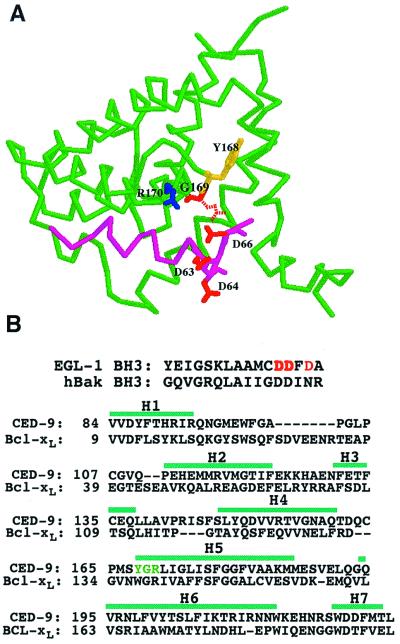
Figure 3.
Modeled structure of the complex between the BH3 domain of EGL-1 and CED-9. (A) Ribbon stereodrawing of the modeled complex. Backbones of CED-9 and EGL-1 (BH3 domain) are shown in green and magenta, respectively. Potentially critical interface residues are depicted with colored sticks: Y168 (yellow), G169 (red), and R170 (blue) in CED-9 and D63, D64, and D66 (all in red) in EGL-1. The dashed Glu residue at the position of G169 in CED-9 indicates the gain-of-function mutation in CED-9. (B) Sequence alignments between the BH3 domains of EGL-1 and human Bak and between CED-9 and Bcl-xL. The sequence alignment between CED-9 and Bcl-xL was optimized using the SWISS-MODEL program (24). The previously defined seven α-helices (H1–H7) in Bcl-xL are indicated with green bars (25).

