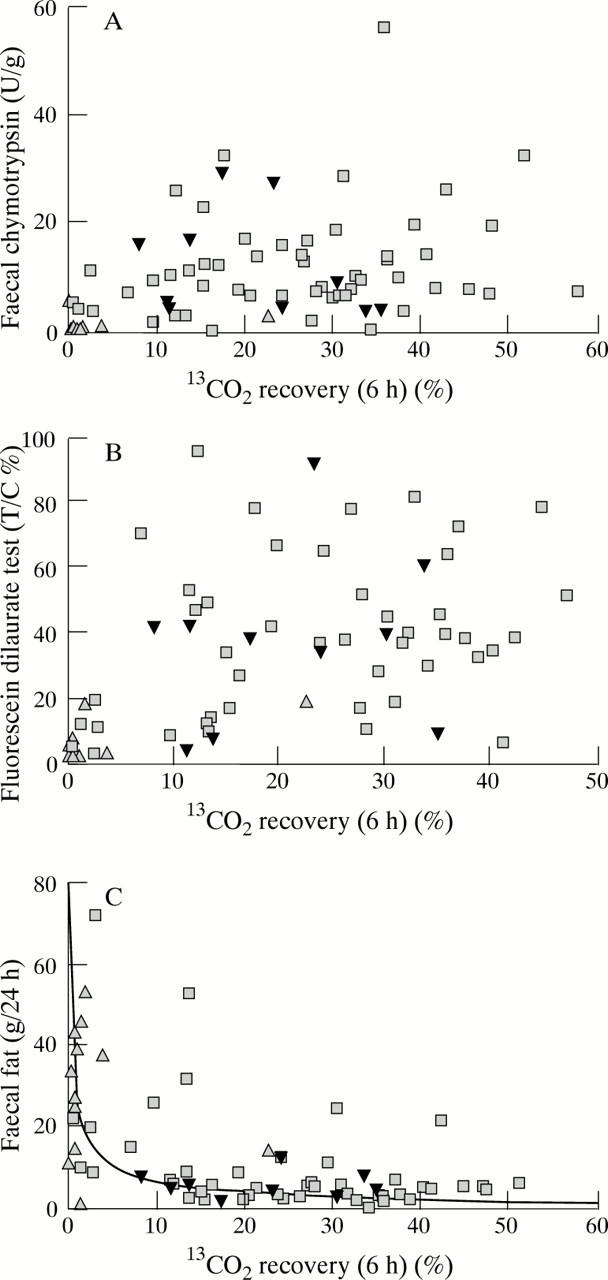
Figure 3 .

Relations between the six hour 13CO2 recovery of the cholesteryl-[1-13C]octanoate breath test and faecal chymotrypsin concentration (A), fluorescein dilaurate test results (B), and faecal fat (C). In graph C, the curve was drawn manually and represents the best fit for the points. Inverted triangle, mild to moderate CPD; upright triangle, severe CPD.
