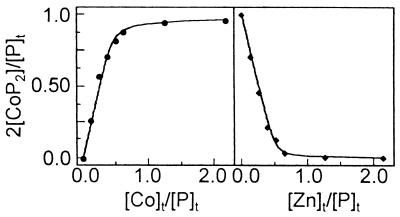
Figure 6.
(Left) Spectrophotometric titration of METP peptide with Co(II). The saturation fraction 2[CoP2]/[P]t is plotted against the concentration ratio [Co]t/[P]t. Solid line shows the best fit of data points to Eq. 1. (Right) Spectrophotometric competition experiment of Co(II)-METP complex with Zn(II). The saturation fraction 2[CoP2]/[P]t is plotted against the concentration ratio [Zn]t/[P]t. Solid line shows the best fit of data points to Eq. 2.

