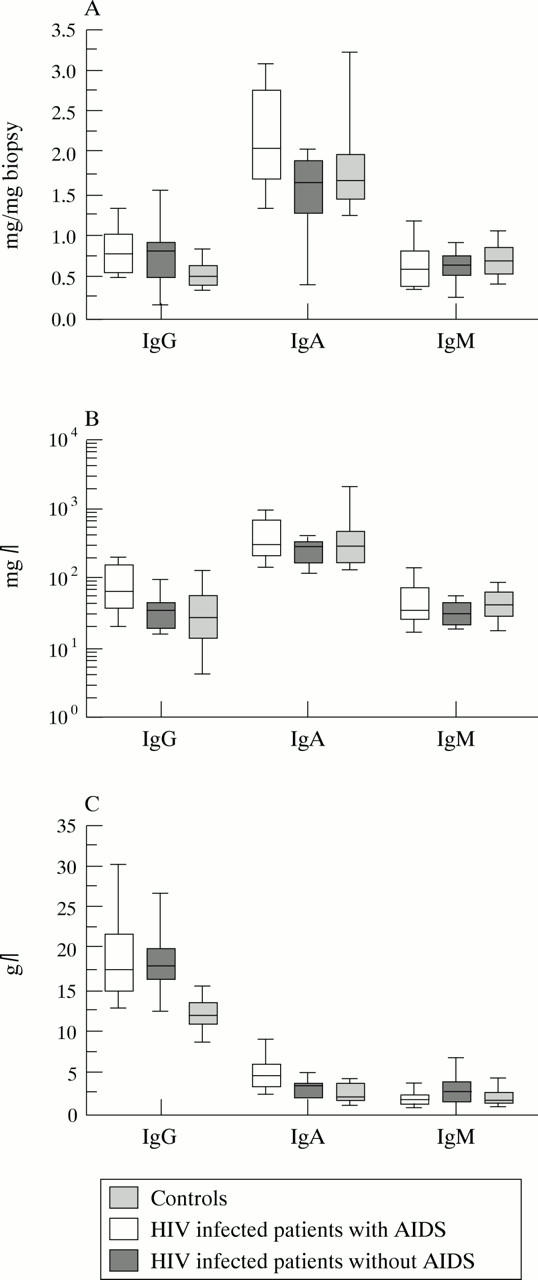
Figure 3 .

Quantitative analysis of the three isotypes in (A) duodenal biopsy supernatants, (B) saliva, and (C) serum from controls, HIV infected patients with and without AIDS displayed as box plots. Bold horizontal bars represent the median; lower and upper ends of the boxes represent 25th and 75th percentiles respectively; lower and upper "whiskers" represent the 10th and 90th percentiles respectively.
