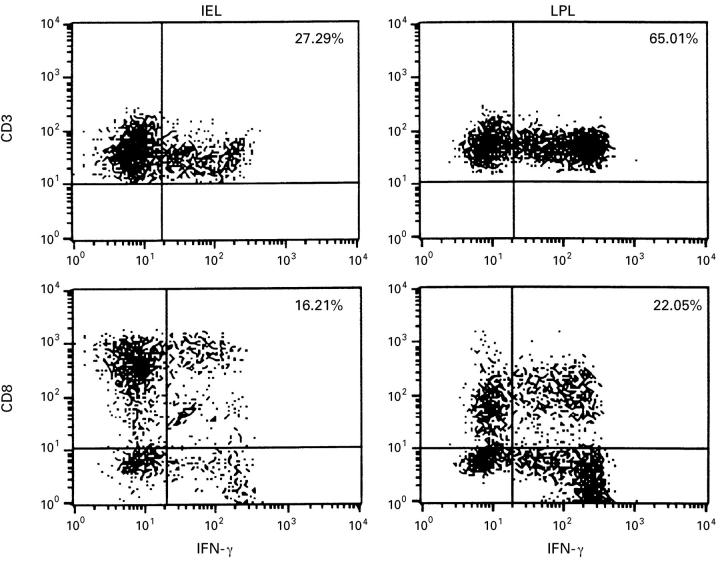
Figure 2 .
Dot plots from three colour flow cytometric analysis for anti-IFN-γ on CD3+ and on CD8+ or CD8 cells for IEL and LPL. The cells were cultured for four hours with PMA and ionophore A 23187 in the presence of brefeldin A. The fluorescence plots shown are representative of one of three different experiments and cells analysed were gated for CD3+ cells so that results are given as percentage of CD3+ cells. Control isotype was used to differentiate positive from negative immunofluorescence.

