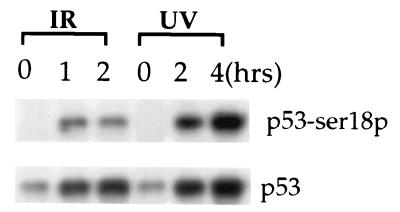
Figure 2.
Phosphorylation of mouse p53 at Ser-18 in ES cells at various times after IR or UV treatment. ES cells were exposed to 5 Gy IR or 60 J/M2 UV light. Cell extracts from irradiated cells and untreated controls were analyzed by Western blotting with antibodies specific for p53 or p53 phosphorylated at Ser-18. The phosphorylated p53 (Top) and total p53 are indicated. Time after irradiation is indicated at the top of each lane.

