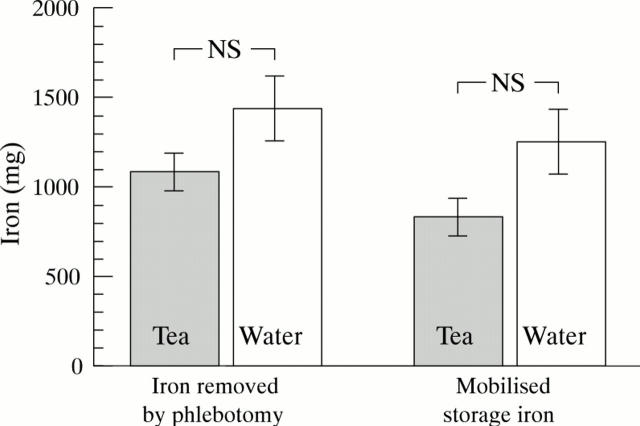
Figure 4 .
Storage iron accumulated over one year. Columns on the left show the amount of iron removed by phlebotomy in the tea drinking and control groups at the end of the observation period; columns on the right show mobilised storage iron, calculated as iron removed by phlebotomy corrected for iron absorbed during the time course of the phlebotomies (see the text). The differences between the tea and water drinking groups are statistically not significant (t = 1.63 and 2.04; p<0.05 would require 2.12).

