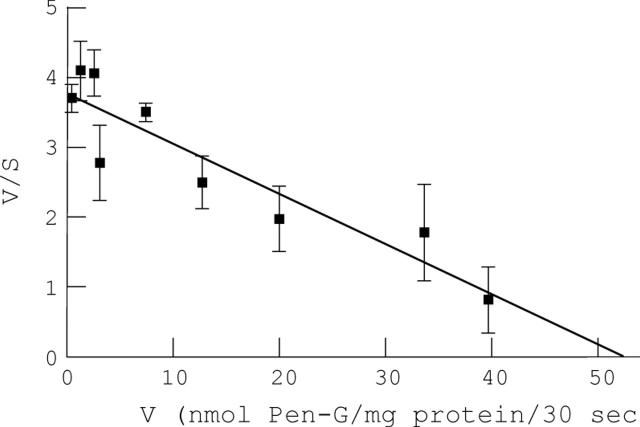
Figure 4 .
Eadie-Hofstee plot of penicillin G uptake in hBBMV. Vesicles were loaded with 50 mM HEPES/Tris, 0.1 mM MgSO4, 50 mM mannitol, 100 mM KCl at pH 7.1. The external buffer contained 100 mM KCl, 0-50 mM mannitol (to correct for penicillin G addition), 50 mM MES/Tris pH 5.0, and 0.1-50 mM penicillin G. Samples were incubated for 30 seconds at 37°C. Results represent the average of three distinct experiments carried out in triplicate. Error bars represent standard deviation. Vmax = 52 nmol/mg protein/30 sec; Km = 13.9 mM; r=0.924.

