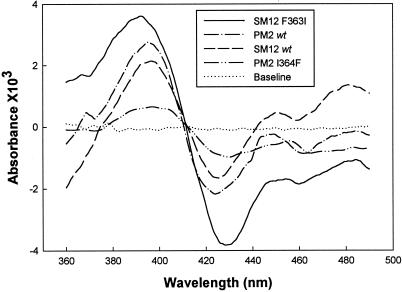
Figure 4.
(−)-Limonene-induced binding spectra obtained with membranous preparations of SM12, PM2, SM12 F363I, and PM2 I364F. Spectra were recorded at 0.2 mg of protein/ml (corresponding to 92, 294, 104, and 75 pmol of P450 for SM12 F363I, PM2, SM12, and PM2 I364F, respectively) with 100 μM (−)-limonene (for PM2 I364F, the limonene concentration was 200 μM).

