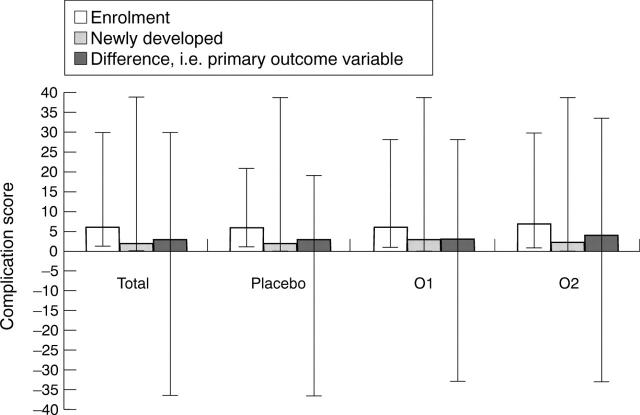
Figure 2 .
Scores for complications on enrolment, newly developed complications, and their difference in the intent to treat patient group. Results expressed as medians and ranges. The difference in complication scores (enrolment minus new complications) was computed for each patient. The median of the individual differences was then calculated.

