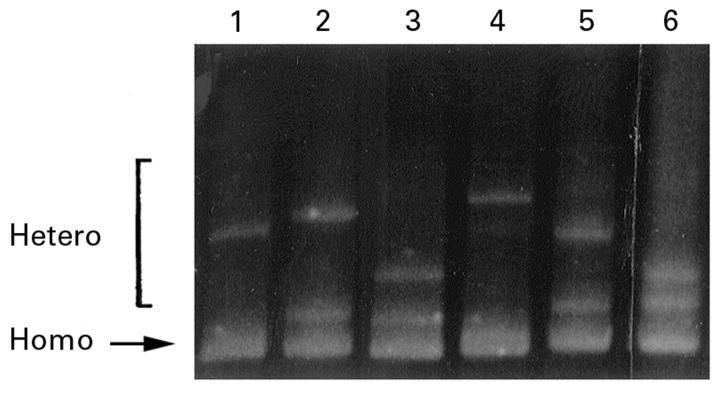
Figure 3 .
TTGE gel showing migration patterns of K-ras exon 1 fragments. All lanes show different migration patterns at the upper bands (heteroduplex bands), indicating different K-ras mutations. The lower band is the homoduplex band. Lanes 1-5 show codon 12 mutations: (1) GTT (valine); (2) TGT (cysteine); (3) GAT (aspartate); (4) GCT (alanine); and (5) AGT (serine). Lane 6 shows a codon 13 GAC mutation (aspartate).

