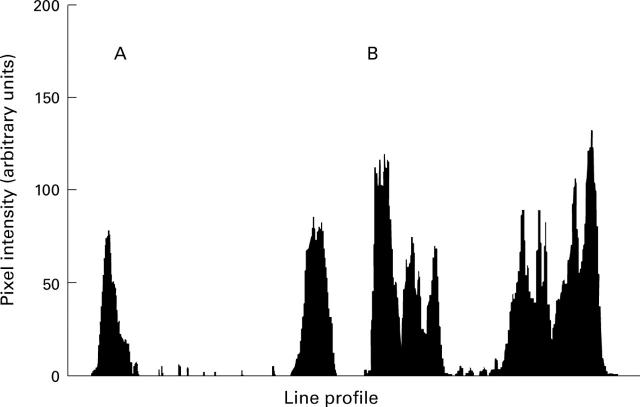
Figure 3 .
Frequency distribution of the pixels referring to cellular fluorescence in optical sections from hepatocytes stained with liver/kidney microsomal antibody type 1 (LKM1) positive serum (diluted 1:40) and fluorescein labelled goat anti-human IgG (diluted 1:200). (A) Typical distribution in non-permeabilised hepatocytes; (B) distribution in hepatocytes that were permeabilised before fixation as reported in the Methods section.

