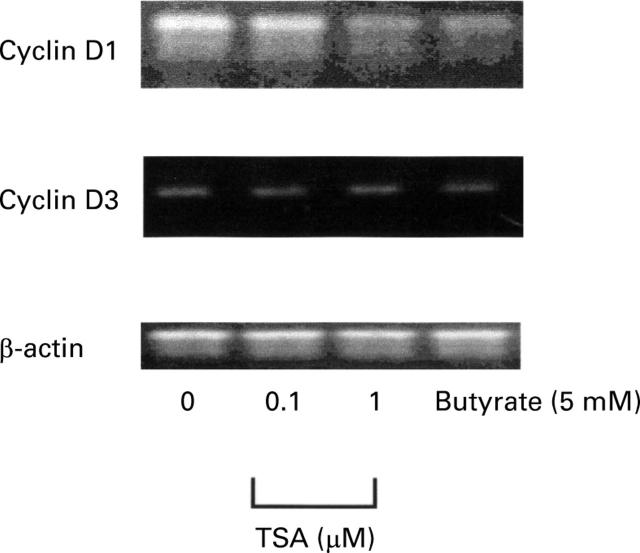
Figure 4 .
Comparison of the effect of trichostatin A (TSA) and butyrate on cyclin D1 and D3 mRNA as studied by reverse transcription-polymerase chain reaction (RT-PCR). PCR products were analysed on a 1.5% agarose gel stained with ethidium bromide. Primers and conditions are specified in Materials and methods. β-Actin is shown as a control. The sizes of the PCR products were 620 bp for β-actin, 577 bp for cyclin D1, and 264 bp for cyclin D3.

