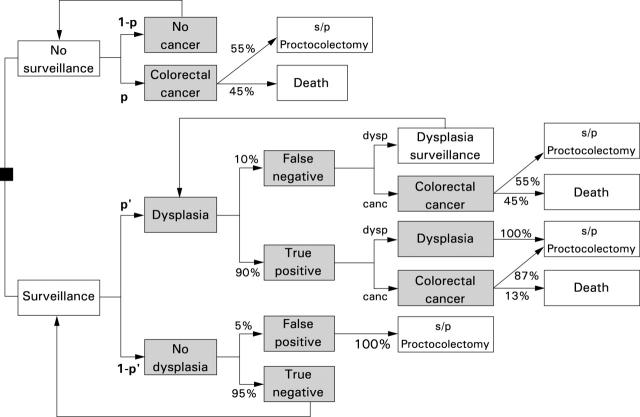
Figure 1 .
Markov state diagram of surveillance and no surveillance for colorectal cancer. The white rectangles represent true Markov states where subjects remain for the complete length of a cycle. The shaded rectangles represent intermediate states, which subjects can enter and leave during one cycle before settling in a true Markov state. The transition p represents the incidence rate of cancer per cycle, p' represent the incidence of high grade dysplasia. In patients with high grade dysplasia, dysp represents the fraction of patients with dysplasia alone, while canc represents the fraction of high grade dysplasia accompanied by cancer.

