
Figure 2 .
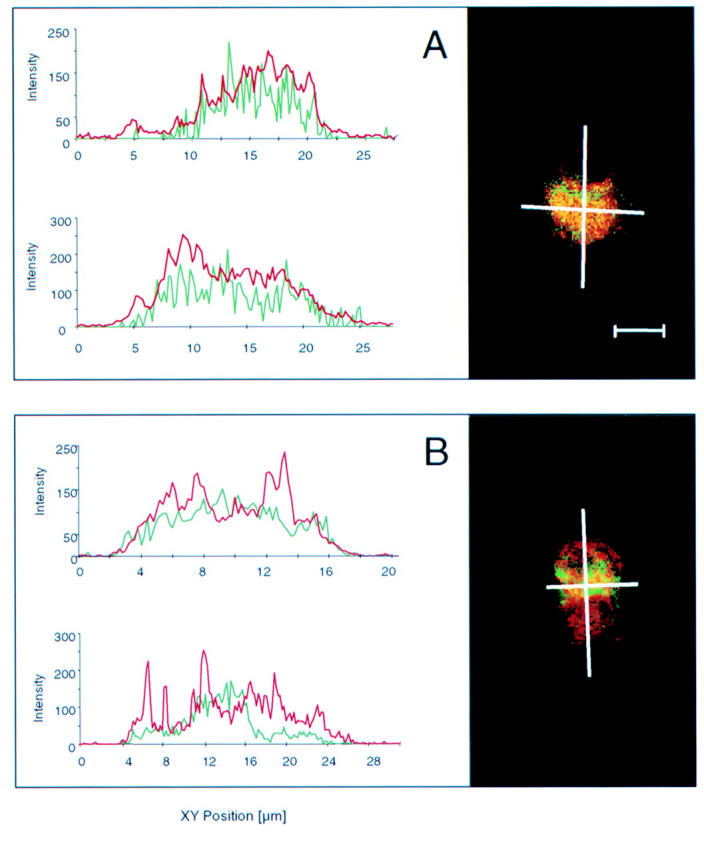
Confocal laser scanning microscopy of apoptotic ethanol fixed neutrophils. Antineutrophil cytoplasmic antibodies (ANCA) were detected with tetramethylrhodamine isothiocyanate (TRITC) which produces a red signal at wavelengths longer than 590 nm. Apoptotic DNA was visualised with TUNEL (TdT mediated FITC-dUTP nick end labelling), an in situ programmed cell death labelling method based on detection of DNA strand breaks labelled with fluorescein isothiocyanate (FITC) which gives a green signal at wavelengths of 500-560 nm. (A) With most sera, ANCA staining showed diffuse colocalisation with apoptotic cleaved DNA (oligonucleosomes and nucleosomes). Cross over fluorescence between FITC (cleaved DNA) and TRITC (ANCA) is shown by yellow staining. Almost complete superimposition of the profile of staining intensity obtained by channel 1 (red profile, ANCA) and that obtained by channel 2 (green profile, cleaved DNA) may be observed. (B) With three sera the ANCA staining intensity (red signal) was higher than that of apoptotic DNA (green signal) in some areas of the apoptotic neutrophils. These areas morphologically correspond to apoptotic blebs beyond the cytoplasmic membrane. The ANCA fluorescence profile (green profile) partly superimposed with the DNA profile (red profile) but exceeded the boundary of the apoptotic DNA. Bar=10 µm.