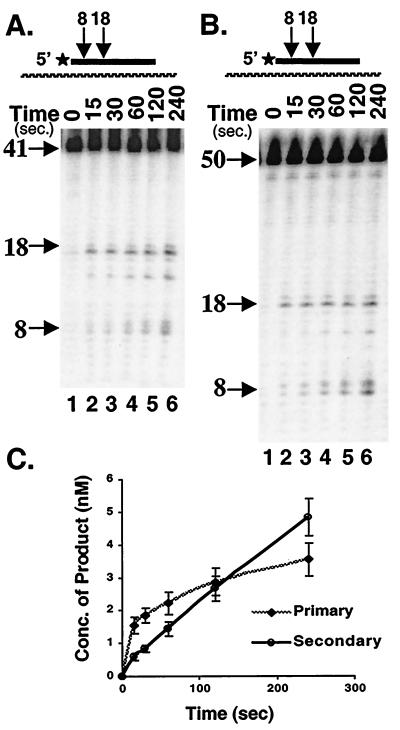
Figure 2.
An RNase H time course assay of the primary and secondary cuts using an excess of substrate to enzyme. (A and B) The time course experiment with the 5′ end-labeled 41- and 50-nt RNA substrates, respectively. Above each panel is a representation of the substrate. The length of each product is indicated by the numbered arrows. The star indicates the position of the 32P label. Each experiment was performed with a ratio of 1 enzyme to 37 substrates. The time points are indicated above each lane. The numbered arrows indicate the lengths of the starting material and products, which were determined from an RNA ladder created by base hydrolysis. The 18- and 8-nt products correspond to the primary and secondary cuts. (C) A representative graph of the 41-nt RNA substrate and is plotted as concentration of product formed versus time.

