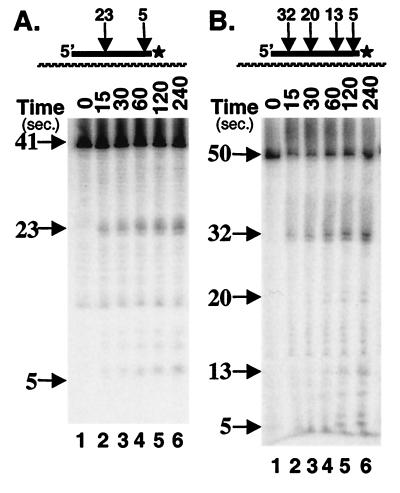
Figure 4.
A time course of the primary, second primary, and 5-nt cuts using an excess of substrate to enzyme ratio. The star at the 3′ end represents the 32P label. As in the previous figures, the numbered arrows adjacent to the image indicate the length of the starting material and products. (A) The time course with the 41-nt substrate. The 23-nt product is the primary cut. The 5- to 7-nt products are the second primary or 5-nt cuts. (B) The experiment using the 50-nt RNA substrate. The 32-nt product represents the primary cut. The 20- to 22-nt and 17- to 13-nt products are the second primary cuts. The 5-nt band represents the 5-nt cut.

