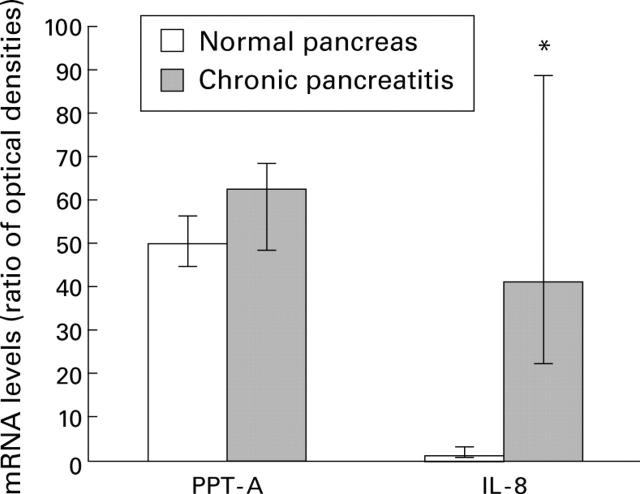
Figure 2 .
Densitometric analysis of northern blots. Preprotachykinin A (PPT-A), interleukin 8 (IL-8), and glyceraldehyde-3-phosphate dehydrogenase (GAPDH) mRNA levels were analysed by laser densitometry in the normal pancreas and in chronic pancreatitis. The ratio of the optical density between PPT-A, IL-8, and the corresponding GAPDH signal was calculated. Bars represent the median with upper and lower quartiles. *p<0.001.

