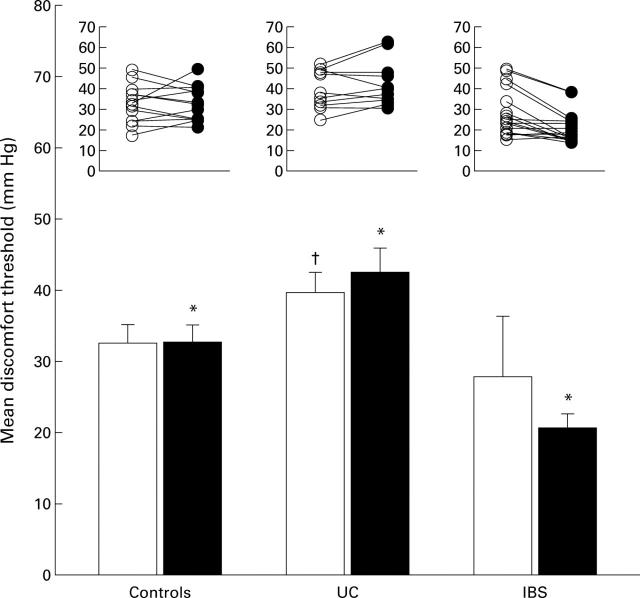
Figure 3 .
Rectal discomfort thresholds in normal controls, and in patients with ulcerative colitis (UC) and inflammatory bowel disease (IBS) before (open columns) and after (filled columns) noxious sigmoid stimulus. (Bottom) Mean rectal discomfort thresholds are shown; *significant differences compared with the two other groups (p<0.05); †significant difference compared with IBS group. (Top) Individual rectal discomfort thresholds. In this and subsequent figures, values are mean (SEM).

