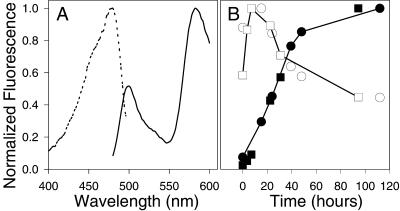
Figure 1.
DsRed maturation proceeds through a green intermediate. (A) Excitation spectrum (dashed line, emission collected at 500 nm) and emission spectrum (solid line, excitation at 475 nm) of bacterially expressed DsRed taken immediately after purification. (B) Time course of green to red conversion. Open symbols indicate green fluorescence (475-nm excitation, 500-nm emission). Filled symbols indicate red fluorescence (558-nm excitation, 584-nm emission). Squares and circles denote two separate trials. Each curve has been normalized by its maximum value to permit comparison of the time courses. The maximum green fluorescence is <1% of the maximum red fluorescence.

