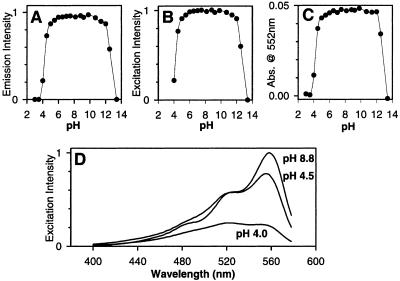
Figure 3.
pH dependence of DsRed fluorescence and absorbance. (A) 583-nm emission monitored with 558-nm excitation. (B) 558-nm excitation monitored with emission at 583 nm. (C) Absorbance at 552 nm. (D) Excitation spectra of DsRed (emission monitored at 583 nm) at pH 8.8, 4.5, and 4 showing spectral shape change.

