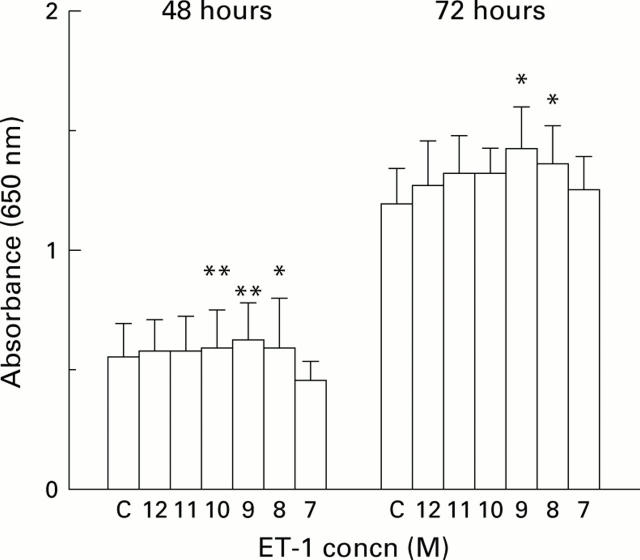
Figure 3 .
Effect of addition of endothelin 1 (ET-1) on HT29 cell growth. Cells were grown for 48 or 72 hours in the presence of increasing concentrations of ET-1 (10−12 M to 10−7 M, shown on the x axis as 12 to 7). Cell growth was measured using the methylene blue assay and read as absorbance (equivalent to cell numbers) at 650 nm. Results are shown as mean (SD). Statistically significant cell growth is shown as *p<0.05 or **p<0.01 (Student's paired t test). C, control.

