
Figure 4 .


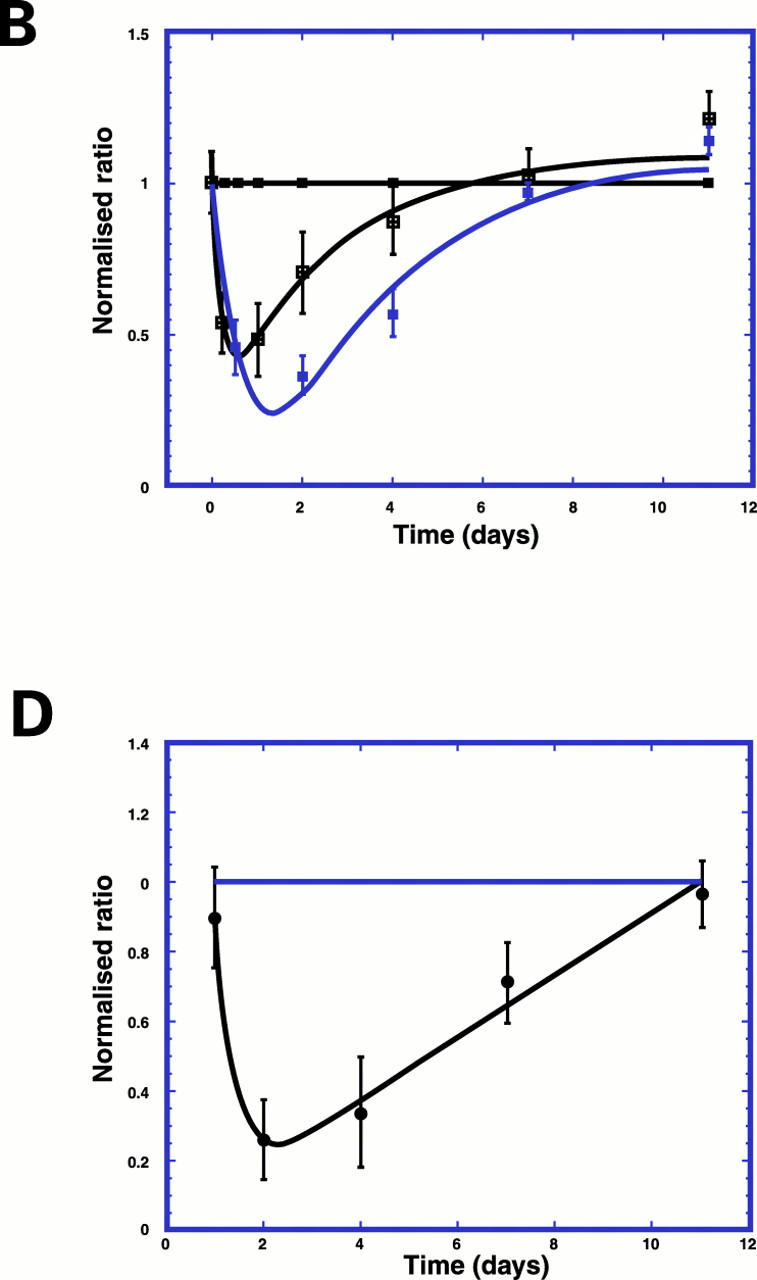
Decrease in α smooth muscle actin, OB cadherin, and collagen type IV in pericryptal sheath region after radiation. (A) Confocal images (depth 20 µm) showing decrease in smooth muscle actin in pericryptal areas after 8 Gy radiation. (B) Time course of smooth muscle actin (blue) and OB cadherin (green) in pericryptal sheath cells after 8 Gy radiation showing maximal decreases at two days and recovery after seven days. Data shown (n=3) as normalised ratios against control. (C) Confocal images (depth 20 µm) showing decrease in collagen type IV in pericryptal areas after 8 Gy radiation. (D) Time course of collagen type IV in pericryptal sheath after 8 Gy radiation showing maximal decreases at 2-4 days and recovery after 11 days. Data shown (n=3) as normalised ratios against control.