
Figure 2 .
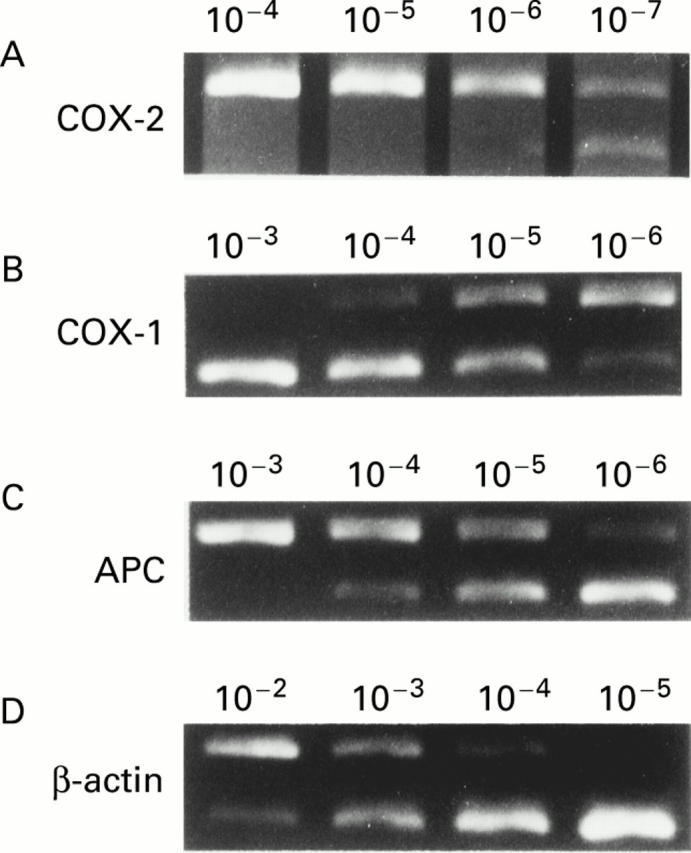
Analysis of cyclooxygenase (COX)-2, COX-1, adenomatous polyposis coli (APC), and β-actin mRNA expression. mRNA extracted from rat colonic tissue was reverse transcribed and amplified in the presence of different amounts of mimic DNA (lanes, from left to right: 10−4, 10−5, 10−6, 10−7 ng for COX-2; 10−3, 10−4, 10−5, 10−6 ng for COX-1 and APC; 10−2, 10−3, 10−4, 10−5 ng for β-actin). (A) COX-2 expression in colonic tissue of a representative rat in group 3. The level of COX-2 expression was 10−7 ng in this case. (B) COX-1 expression in the same rat as in (A). The level of target cDNA of COX-1 was 10−5 ng in this case. (C) APC expression in colonic tissue of a representative rat in group 2. The level of target cDNA of APC was 10−5 ng in this case. (D) β-actin expression in the same rat as in (C). The level of target cDNA of β-actin was 10−3 ng in this case. The level of β-actin expression was used as an internal control.