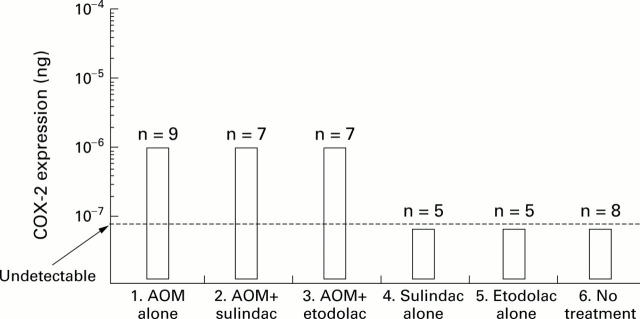
Figure 4 .
Levels of COX-2 mRNA expression measured by RT-competitive PCR. Data are shown as box plots: the box covers all values (including minimum and maximum values). The broken line indicates the limit of detection for COX-2 mRNA expression by RT-PCR. Levels of COX-2 expression in each case were normalised to that of β-actin mRNA (10−3 ng of mimic DNA). There was a tendency towards increased levels of COX-2 expression in the groups administered azoxymethane (AOM). However, levels were not significantly different between groups.

