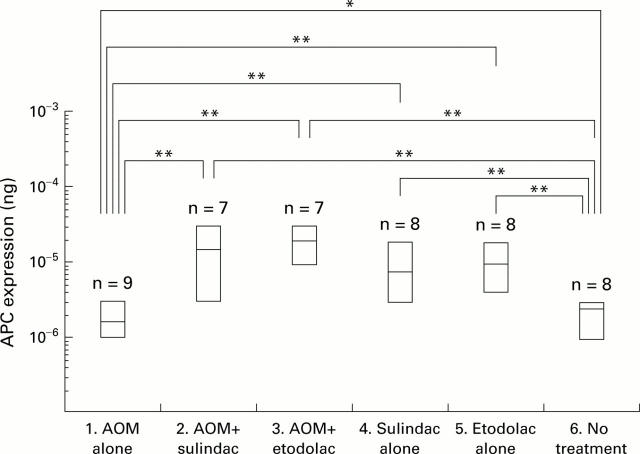
Figure 6 .
Levels of adenomatous polyposis coli (APC) expression measured by RT-competitive PCR. Data are shown as box plots: the box covers all values (including minimum and maximum values), and the central continuous line in each box represents the mean. Levels of APC expression in each case were normalised to that of β-actin mRNA (10−3 ng of mimic DNA). APC mRNA expression level in group 1 (azoxymethane (AOM) alone) was significantly lower than that in group 6 (untreated control) (p<0.05). Both sulindac and etodolac caused an increase in APC mRNA in the rat colonic mucosa (groups 2, 3, 4, and 5) (p<0.01). *p<0.05; **p<0.01.

