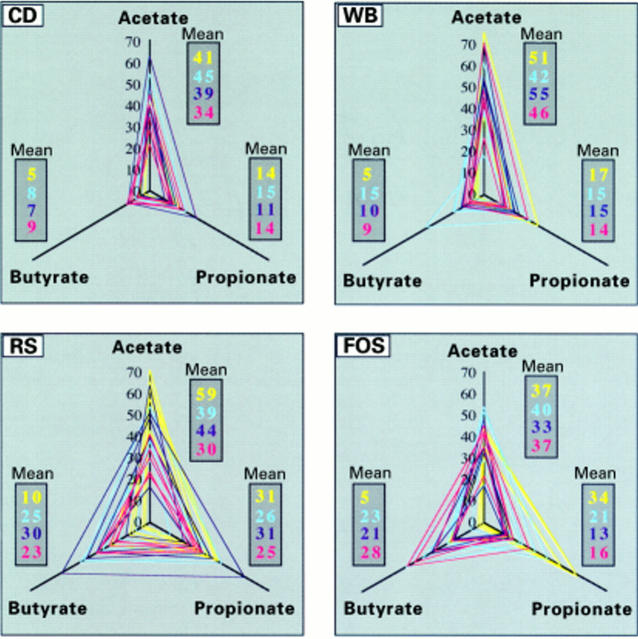
Figure 3 .
Changes over time in the relationships between the major short chain fatty acids (SCFAs) issued from fermentation of the four diets (low fibre control diet (CD), starch free wheat bran enriched diet (WB), type III resistant starch enriched diet (RS), and short chain fructo-oligosaccharide enriched diet (FOS)). The axes indicate individual mean large intestine concentrations (an average of caecum, and proximal and distal colon concentrations, expressed in µmol/g wet content) of acetate, propionate, and butyrate for each rat. These values are linked to form a triangle representing the mean fermentation pattern of the rat. The triangle area is proportional to global SCFA production, and the ratio (relative concentration) of each SCFA can be determined from the shape of the triangle, regardless of its size: the more acute the angle, the higher the ratio. Each dark gray box indicates the mean values of one SCFA concentration for a given time and diet. Colour coding for feeding periods is yellow for D2, blue for D16, dark blue for D30, and red for D44.

