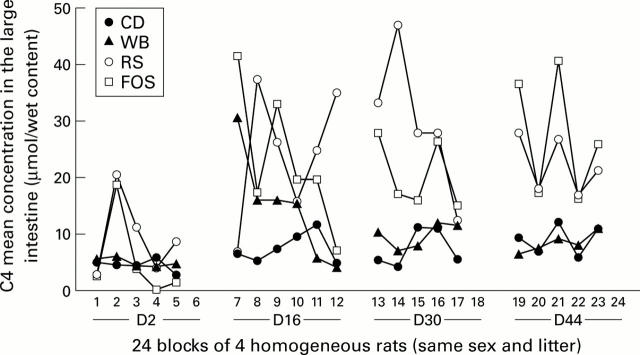
Figure 5 .
Time and interindividual effects on the mean butyrate large intestine concentration (µmol/g wet content) in rats from the 21 blocks (four rats of the same litter, sex, and feeding period) in this part of the study. The four rats of one block are on the same vertical. To facilitate interpretation, lines have been drawn linking the butyrate concentrations of animals fed the same diet for a given period. On D44, mean butyrate concentrations were higher for the short chain fructo-oligosaccharide enriched diet (FOS) than for the type III resistant starch enriched diet (RS), but this was only due to higher caecal concentrations.

